People & Culture
On thin ice: Who “owns” the Arctic?
As the climate heats up, so do talks over land ownership in the Arctic. What does Canadian Arctic Sovereignty look like as the ice melts?
- 4353 words
- 18 minutes
This article is over 5 years old and may contain outdated information.
Mapping

The hottest year ever. By now you’re undoubtedly familiar with the recent report from the World Meteorological Organization that noted global average surface temperatures in 2015 were the warmest ever recorded, a whopping 0.76 C above the 1961-1990 average.
Of course, you may have also heard that Canada bucked the worldwide trend, with an average temperature just 0.1 C hotter than the average since 1947.
Regional differences in the impacts of global climate change are likely one of the primary factors for the discrepancy. Coincidentally, a new map (pictured), and the data associated with it, released in conjunction with a recent study published online by the journal Nature Climate Change, present stark evidence of the cumulative effect of carbon dioxide emissions on local temperature change in the last century.
As is clearly evident, the Arctic has generally experienced temperature increases of 4 to 6 C and much of the upper half of the northern hemisphere has experienced temperatures 1 to 2 C more than the global 1 C average in the past century per trillion tonnes of carbon.
Co-authored by Damon Matthews, a professor in the department of geography, planning and environment at Montreal’s Concordia University, post-doctoral researcher Martin Leduc and Ramón de Elía of Ouranos, a private, Montreal-based climate change research organization, the study combined the results of 12 different global climate models.
Beyond the sheer visual impact of the map and the results it shows, the study found that temperature increases in many regions of the world relate directly to cumulative emissions. It also concluded that there is a 2.2 C increase per trillion tonnes of carbon over land and a 1.4 C increase per trillion tonnes of carbon over ocean — results the researchers believe link human-made CO2 emissions to local-scale impact.
Are you passionate about Canadian geography?
You can support Canadian Geographic in 3 ways:
People & Culture
As the climate heats up, so do talks over land ownership in the Arctic. What does Canadian Arctic Sovereignty look like as the ice melts?

Environment
As the impacts of global warming become increasingly evident, the connections to biodiversity loss are hard to ignore. Can this fall’s two key international climate conferences point us to a nature-positive future?
Environment
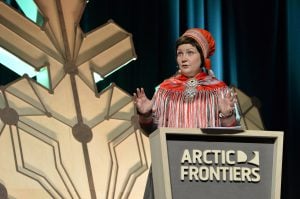
The uncertainty and change that's currently disrupting the region dominated the annual meeting's agenda
Environment
Warming trends continue due to human-caused climate change