People & Culture
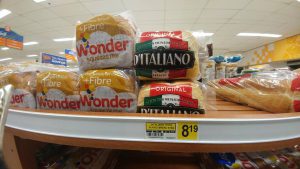
Nunavut gets failing grade on food security
Conference Board of Canada’s food report card highlights problems territory’s residents have feeding themselves
- 548 words
- 3 minutes
Mapping

On the map, the dots indicate diabetes is everywhere, in high-income and low-income neighbourhoods, in areas where supermarkets abound and where they’re absent. That doesn’t surprise Dr. Chris Green: “We all inhabit the same foodscape.”
The Winnipeg Food Atlas was spearheaded by Green, an epidemiologist (and GIS whiz) with the Winnipeg Regional Health Association, and his wife Joyce Slater, a nutrition professor at the University of Manitoba. Under the auspices of the Manitoba Collaborative Data Portal, a collective of food and nutrition community groups spent two years compiling data and deciding what information to include before the map launched in February 2020.
The online, interactive map was inspired by food asset maps in cities such as Montreal and Toronto. “We said, we can do that on steroids,” says Slater.
Amongst other benefits, the Winnipeg Food Atlas also functions as a diabetes map of the city that estimates the rates of diabetes in neighbourhoods and the cost to treat it. (For example, it costs $6.3 million annually to treat diabetes in central St. Boniface.) The map’s compelling presentation has drawn attention from endocrinologists, along with city councillors and provincial politicians who are interested in how healthy eating can lower the cost of diabetes. The rate of diabetes in each neighbourhood is estimated based on small area counts of diagnosed diabetes, while the cost to treat diabetes in an area is based on U.S. figures on per-capita annual costs of diabetes (the costs are scaled down by 50 per cent to reflect the lower costs of Canadian health care).
Besides the diabetes focus, the map’s other innovation is its interactive nature. “In our digital age, this is the time to make information more accessible and impactful if we can,” says Slater. The interactivity means community groups can make various queries and consider different layers of demographic information such as the percentage of recent immigrants along with food “assets” such as farmer’s markets, food banks and schools. The map is designed to be used by community groups who need data to apply for funding, decide how to allocate resources and manage programs. It’s also being used by advocates for school meal programs, and by a high-school geography teacher who uses it to teach how food insecurity relates to urban geography.
The interactivity is also praised by Jeanette Sivilay, coordinator of the Winnipeg Food Council, a citizen advisory committee for the City of Winnipeg that focuses on food security, and one of the groups that helped to create the map. “There’s the potential to add different layers of information later on, such as commercial kitchen locations. That could be useful to us.”
For the summer of 2020, they’ve used the map to pinpoint locations of community gardens — particularly important sources of fresh food in the wake of COVID-19 pandemic — and requested the City of Winnipeg step up water access and water storage for community gardens. “It’s been really helpful for the Food Council to point the city to the Winnipeg Food Atlas, with all the city can do for food security this year.”
Are you passionate about Canadian geography?
You can support Canadian Geographic in 3 ways:
People & Culture
Conference Board of Canada’s food report card highlights problems territory’s residents have feeding themselves
People & Culture
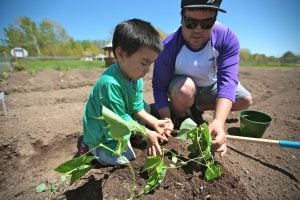
Gardeners dig into a history of resilience to feed people during COVID-19

Travel
Immerse yourself in Viking archaeology and Basque whaling history while taking in Newfoundland’s scenic coastline and incredible geology

People & Culture
Here are a few of the ways community-led projects, government programs and other organizations are helping to feed northern populations